Monday, November 30, 2009

That that is, is and that that is not, is not. Was this a T?


Was this a T or a bearish T? That is the question.  This market is having a hard time digesting the news from the Middle East and the financial crisis in Dubai.  The most troubling aspect of this news is the efforts of the governments involved to censure the news.  Nothing good will come of this.  "By the pricking of my thumbs, something wicked this way comes."
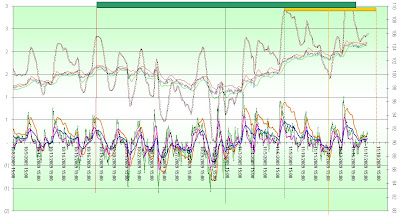
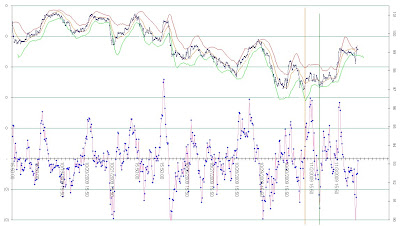
By all aspects, all T's have expired and I am looking for a level to short the market.  I will look for a signal from the trend indicator chart below.  The oscillator turns positive in an up move and it turns negative in a down move.  The horizontal lines are drawn at one (1) standard deviation of the oscillator.  If the indicator moves above one (1) standard deviation, I will look to short the market.


The price of the DIA is trading right on support.  It seems to me that if this support is broken the price is in for a fall.  If this reaction does occur, the next center post will be easily identified and we will be prepared for the next bull move.

Friday, November 20, 2009

Covered all My Positions

Sold BGZ @ 18.95    +$0.98
Bot  BGU @ 48.27    +$9.63
Sold DXD @ 30.55   +$0.51
Bot  DDM @ 42.65   +$0.75
Bot  DIA @  102.90  -$0.27

Is it Time to Cover my Short Positions?


 The two charts above illustrate the difference between a basic oscillator and a derivative function that that smooths the vicissitudes of the basic oscillator.  The derivative oscillator also illustrates a persistence in a trend once the trend changes.
In my previous posts I have noted whenever I put on a position.  My current positions reflect a net short position in the market averages with the following derivative ETF's:
Long BGZ @ 17.97
Short BGU @ 57.9
Long DXD @ 30.04
Short DDM @ 43.40
Short DIA @ 102.63
The question is where and when do I cover and take my profits?  The top chart with a derivative function looks like it may be changing direction, however, it remains in negative territory.  Today is Option Expiration Friday so anything can happen this afternoon.  I have decided to close out my positions and will report my prices in my next post.  It is 1:13 PM 11/20/09.

Wednesday, November 18, 2009

Time to Short The DIAMONDS


I am shorting the Diamonds by Buying DXD @30.04 and simultaneously Shorting the same amount of DDM @ 43.40. 

Correction: T Expires at 1:10 PM today!!

I previously stated that the latest T ended at 3:10 PM today.  This is incorrect because I misread the time.  The correct time of expiration is 13:10 or 1:10 PM EST.

For Dino


My friend Dino complained that there is too much technical jargon on this blog so I posted a picture of my fishing buddy just for Dino.

New T expires today at 3:10 PM


The top chart is a pastiche of several graphed functions that help to define the T's.  The smaller T in the top chart began at 12:20 PM on 11/9/09 with the center post set at 9:30 AM on 11/13/09.  This smaller T explains the last rally at the end of the much longer T.  This smaller T is set to expire this afternoon at 3:10 PM.  There is no other structure evident in these 10 minute charts nor is there any supporting structure in the daily charts. T theory suggests that when prices are outside the right side of the magic T the market performance is considerably lower than when inside the time frame of the right side of the T.

The lower chart shows two opposite functions that indicate either an uptrend or a downtrend as they cross.  These derivative functions are further evidence of symmetry in the time series analysis of market averages.

Tuesday, November 17, 2009

Going Short the Market


Above is a 10 min chart of the DIA with a short term direction indicator function that goes negative when the market turns down and positive when the market turns up.  The only thing you have to guess is the duration and persistence of the trend.  Because of the expired T and the obvious manipulation of the Dow Jones Transportation Averages at the close yesterday to make them look bullish, I have gone short of the market.  I shorted BGU at 57.9 and bought BGZ at 17.97.  These are both triple alpha ETF's and are derivatives.  There is an unknown premium and discount in the prices of these derivative ETF's that I hope to overcome by a long and short position that is essentially a net short position.  We shall see how this works out.  I hope you all understand that derivatives are a zero sum game and for every winner in these stocks, there is a loser of exactly the same amount of money.

Monday, November 16, 2009

Transportation Average Closes at a New High

Dow theory says that stock prices can be manipulated in the short term, but the Dow Transportation Average eked out a new high closing price today at 4046.50, so I closed out my positions in the aftermarket.
Sold BGZ @17.85 and covered the BGU @ 58.17.

New Positions

I went long BGZ @ 17.82 and I went Short of BGU @ 58.35

My latest longer term T expired today at 15:00 according to my spreadsheet.

Dow Theory Revisited


The Dow Theory is the first and foremost expounder of the term Divergence.  The two daily graphs immediately above show the daily closing prices of the Dow Jones Industrial and Dow Jones Transportation averages courtesy of StockCharts.com.  Notice that the Transportation average made a lower low and has yet to make a new high.  Note well that in the above chart of the Dow Jones Industrial average the price has continued to make higher highs and higher lows.  Price is the most bullish indicator of the $INDU.  If the $TRAN does not make a new closing high  above 4045.11, the Dow bull market will be put on hold because of the divergence of the trends of the Transportation and the Industrial averages.  The Transportation average must close above 4045.11 to maintain its technical up-trend.  If the Transportation average closes above 4045.11 then cover your shorts and take your losses because we are going higher.  It has been my experience in the past, NOT to trust a rally on declining volume. This is most noticeable in the above charts.  At a critical juncture like this, Goldman can make the Transportation Averages do whatever they want.  Thus we cast our fates to the wind.

DIA 10 min 11-16-09 a Pastiche of Functions


Did we just form a new T?  Does this chart give us a clue as to Mr. Bernake's speech this afternoon.
This could be a new smaller T that is due to expire tomorrow afternoon or it could be a Bear T that could be an indicator for the next center post.  If it is a new T it supports George Rahal's bullish opinion.  Curiouser and curiouser.

Friday, November 13, 2009

DIA 10 min 11-13-09 Longer Term Look at T's and Backtesting an Oscillator


If this market is a fractal then where is the strange attractor?  If we can find the center post of a T in the daily charts using an oscillator then we should be able to discover the same center post after a cash build-up in a chart of smaller time dimension i.e. a ten minute price chart.  In the above 10 minute chart of the Diamonds,  I have back tested an oscillator with the help of an idea I stole from George Rahal.  With attribution to George, in drawing the begining of the middle T, I disregarded the high price of 9/23/09 and began the left side of the middle T on 9/16/09.  I have shown this oscillator in previous charts I have published where this function was drawn in conjunction with another oscillator, however, it is when we isolate this function that we see the predictive ability of this oscillator in determining the cash build-up phase of the T Theory.

The current T will expire this Monday, November 16, 2009 in the afternoon.  In light of the fact that in the longer term time dimension of the daily charts, the most recent T has expired, leaving us in a limbo of indeterminacy where we cannot find the daily direction of a headwind for this market.  I have found it best to trade in the direction of the daily trend while utilizing intra day charts for trade signals.

I put out my first short position in DIA yesterday 11/12/09 at 102.63.  I plan to add to this position between now and Monday afternoon.


Thursday, November 12, 2009

Time to short the Diamonds


In the above charts the blue line is the 10 minute last  price of the DIA.  The top chart shows a trend indicator that goes positive when the trend changes to up and negative when the trend changes to down.  The lower chart depicts two oscillator that cross when the trend changes.  The long term daily T has expired and there is a short term T that expires on Monday November 16, 2009 at 1:40 PM..  I hesitate to get in too early, but I put on part of a position at 12:25 at 102.63 with a close stop.


Wednesday, November 11, 2009

Terry Laundry Revisited


Terry Laundry has recently explained his concept of Bear T's or Failed T's and more recently Phantom T's.  When a Bear T is discovered, it can be used  as a tool to discover the next center post.  In the above chart, the blue line is the 10 minute last price of the DIA and below it is a derivative oscillator based on the last price.  In the chart, utilizing the price and the oscillator I drew the smallest T and since it failed, the end of the T gave us the center post for the second T.  The second T also failed and I used the end of the second Failed T to mark the center post of the current green T.  This latest green T has proven to be an exceptional Bull T.  If I have interpreted T Theory correctly with this oscillator, The current T will expire at 1:40 PM on Monday
November 16 , 2009.

DIA 10 min close November 11, 2009 with Derivitive Oscillator


Monday, November 9, 2009

DIA 10 min 11-9-09 Advance-Decline Magic T


The above chart is a 10 minute intra day proxy for a typical advance decline summation daily chart.  The 10 minute data is simply added to the previous day total and the above chart compares the price and a-d index.  The T that is featured will expire on Tuesday November 10, 2009 at 11:40 AM.

Wednesday, November 4, 2009

An Incorrect Placement of the Center Post Leads to trading error.


In the top chart of the Basic Volume Indicator, the red line shows the incorrect placement of the Center Post of the green T in the middle chart.  The incorrect T was placed at 14:20 on November 2, 2009.  The next green line in the upper chart of the Basic Volume Indicator shows the correct placement of the Center Post at 11:30 yesterday morning, November 3, 2009.  This latest T began at 10:10 on Monday November 2, 2009 and ended this afternoon at 13:00 November 4, 2009. 

When I constructed the green T, I did not place the center post at 14:20 on November 2, 2009.  I made a mistake in the placement and therefore the entire green T is hogwash.  The oversold reading  of the basic volume oscillator gives us a good reading on the last center post, however, the oversold reading of the basic oscillator tends to be too early.  The Center T Oscillator broke down here and was of no help.  I drew a downtrend line over the cash build up phase in order to accurately determine the center post.  Since this last T is expired and we are definitely in a chah build up period and the Daily longer term T has expired, I shorted BGU at 48.83 on the close and bought BGZ at 21.51 on the close. 

I have to think seriously about the jobs report due out on Friday and will not hold any position into the report.  I have had some trouble uploading my charts, otherwise I would have publishes my blog before the Federal Reserve announcement. I think I have solved my problem and hope to be more timely with my postings.

It is very ominous how this market cannot hold on to a rally.  Whenever there is a merger or a buyout like yesterday the market usually soars because the supply of stock has been reduced and there is an injection of cash into the capital markets which naturally drives the price of stocks higher.  Yesterdays market did not act well in the light of the buy out of BNI by Berkshire and the merger of Stanley and Black and Decker.  That is a lot of stock taken out of this market and no significant rally in stock prices to reflect the fundamentals.  I wonder what the jobs report will reflect on Friday AM. 

Stopped OUT

I was stopped out on the opening this AM.  BGU short covered at 49.82 and the BGZ long was sold at 21.12

Tuesday, November 3, 2009

DIA 10 min close November 3, 2009


The chart immediately above is a Center Post Indicator.  This function shows the center post for this T is 14:20 yesterday on November 2, 2009.  This T has just expired.  The middle chart above is the T that just expired.  The chart at the top is a trend indicator that has just moved into the negative as the T has expired.
At 11:11 this morning I initiated a short of BGU at 47.81 and I went long of BGZ at 22.03. 
I am now going out to vote as I hope all of you will do today.

Monday, November 2, 2009


The Daily T has expired so in the longer term we are in a time of market under-performance.  I intend to take advantage of this market weakness and short the rallies.  I will look for center posts in the 10 minute charts in order to find entry prices for shorting the market.  The lower chart is a directional chart of the oscillator which marks a change in trend as it moves from positive to negative.  As you can see at the close on Friday the oscillator was indicating a market rally was beginning.  I will post the prices that I will enter the market later in the session.