Wednesday, November 18, 2009
New T expires today at 3:10 PM
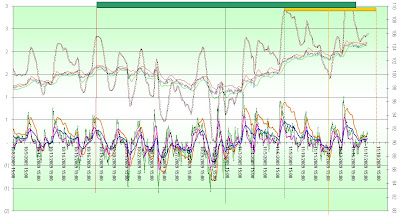
The top chart is a pastiche of several graphed functions that help to define the T's. The smaller T in the top chart began at 12:20 PM on 11/9/09 with the center post set at 9:30 AM on 11/13/09. This smaller T explains the last rally at the end of the much longer T. This smaller T is set to expire this afternoon at 3:10 PM. There is no other structure evident in these 10 minute charts nor is there any supporting structure in the daily charts. T theory suggests that when prices are outside the right side of the magic T the market performance is considerably lower than when inside the time frame of the right side of the T.
The lower chart shows two opposite functions that indicate either an uptrend or a downtrend as they cross. These derivative functions are further evidence of symmetry in the time series analysis of market averages.
Subscribe to:
Post Comments (Atom)


No comments:
Post a Comment